In 2019, renewable energy provided more energy in the U.S. than coal. The last time this happened, in 1885, the Edison Electric Company had been running the first American central power plant for all of three years and was serving just over 500 customers. Across North America and beyond, coal plants are closing—a sign of the times and the end of an era. Driven by both market conditions (low-priced renewable energy system and fossil gas) and policies (Renewable Portfolio Standards, corporate sustainability requirements), there is a clear national and global trend  toward a fossil fuel-free electricity grid. But transitioning to a decarbonized energy system involves much more than just taking coal-fired power plants offline and replacing them with renewables. The grid was built for one-way energy flows from large, centralized power plants, but new policies such as carbon emissions reduction targets are spurring high growth in renewable energy installations both large and small and are forcing grid operators to seek a new paradigm. We are now planning for a grid that can deliver energy to a location and accept energy generated at that location as well for a two-way transaction.
A new LEED pilot credit known as the GridOptimal Buildings Pilot Alternative Compliance Path (ACP), could empower designers, architects and engineers to lead this paradigm shift: a future in which grid-enabled buildings—those with renewable generation and/or controls that communicate with the grid—play a critical role in meeting 100% renewable electricity goals.
Designers can lead the way
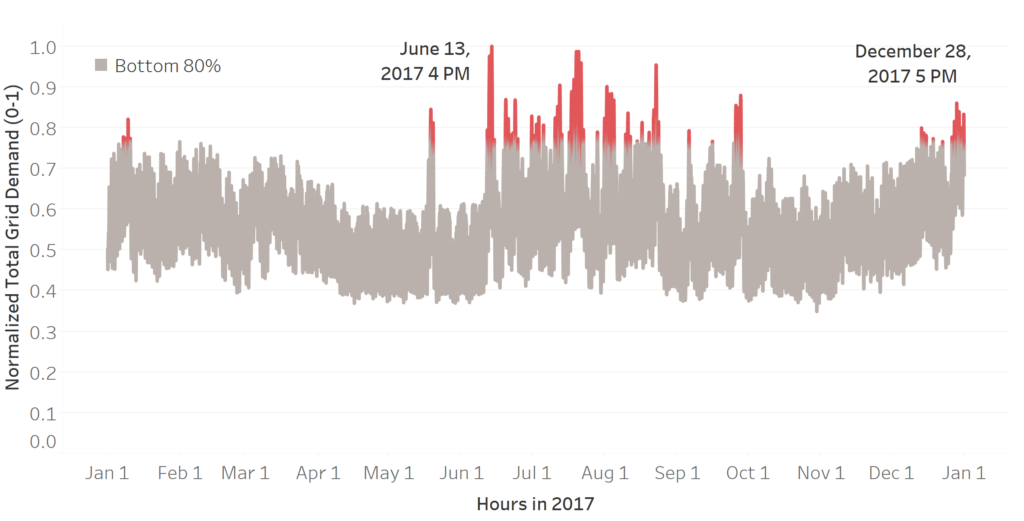
Buildings use about three quarters of the electricity in the United States, and more than 80% during peak hours when energy demand is the highest. With the electricity grid existing mainly to serve buildings, our future built environment will play a critical role in the energy transformation. Rather than thinking of buildings as energy consumers and of power plants as energy generators, we need to think of both as part of a larger energy system. For example, buildings can help solve peak demand issues and offer a range of grid services to help meet other electricity system requirements: managing quality issues like voltage control, power quality, and acting as virtual power plants to provide reserve capacity for the energy system. Building systems and distributed energy resources (DERs) will act, in effect, as part of the generation mix. With the right communications technologies, buildings and DERs can “talk” to the grid in ways that help ensure electricity is most effectively managed and delivered. For example, at times of when there is high demand that strains the grid, buildings can maximize use of onsite renewable production or draw on local storage including EV fleets. This new area of focus, known as grid-enabled efficient buildings or building-grid harmonization, represents an important shift in the way buildings and the grid interact. Architects, engineers, developers, and builders can help lead the transition to a decarbonized grid.
From a design perspective, pursuing building grid harmonization will help building owners “future-proof” their assets in a number of ways:

- Saving on utility costs: Time-of-use rates, demand charges, real-time pricing and perhaps carbon pricing will be coming soon to a jurisdiction near you.
- Regulatory risk management: Cities and other jurisdictions are drafting and enacting rules that serve as carrots and sticks for building time-of-use energy and greenhouse gas (GHG) optimization (e.g., New York City’s Local Law 97 places carbon caps for energy use on most buildings larger than 25,000 square feet and issues penalties for noncompliance).
- Achieving corporate or institutional goals: By trimming loads during high-carbon peak hours and taking advantage of low-cost, clean energy when available, designers can help their clients meet GHG goals (Google has pledged to use 100% carbon free energy 24/7 by 2030).
Introducing the GridOptimal Buildings ACP
Up to three points for building grid optimization measures are now available for projects pursuing LEED v4 or LEED v4.1 through the GridOptimal Buildings Pilot Alternative Compliance Path (ACP). This builds on the groundwork laid by the GridOptimal Buildings Initiative, a joint initiative of New Buildings Institute (NBI) and USGBC. Examples of metrics used to measure improvements in building-grid harmonization are outlined in the chart below.
| Metric | What It Measures |
| Grid Peak Contribution | Degree to which building demand contributes to load on the grid during system peak hours |
| Grid Carbon Alignment | Degree to which the building demand contributes to upstream (grid) carbon emissions over a year |
| Onsite Renewable Utilization Efficiency | Building’s consumption of renewable energy generated on-site (not exporting to grid) over a year |
| Short-Term Demand Flexibility | Building’s ability to reduce demand (shed) for 1 hour |
| Long-Term Demand Flexibility | Building’s ability to reduce demand (shed) for 4 hours |
| Dispatchable Flexibility | Building’s ability to automatically reduce demand (shed) for 15 minutes, controlled by utility/ third party |
The ACP is currently available only to projects pursuing certification under the LEED for Building Design and Construction (BD+C). Based on feedback from project teams using this ACP, NBI and USGBC will consider adapting this pathway for the LEED existing buildings rating system in the future.

Project teams can pursue multiple options to score one, two, or three points using the GridOptimal Buildings ACP. All three points use the energy simulation developed to document compliance with the EA Minimum Energy Performance prerequisite or Optimize Energy Performance credit. The modeled hourly whole-building energy consumption data (i.e. the 8760 load shape) for both the baseline and proposed building cases are used to calculate GridOptimal metrics. Teams paste these model outputs into the GridOptimal metrics calculator to evaluate and report their scores. Teams also enter in a few other data inputs: basic building information such as size and location and information about relevant building assets that can provide demand flexibility (such as shedding load in response to grid conditions, as in a demand response program).
Project teams can achieve one point simply for calculating and reporting GridOptimal Metrics. To achieve up to two additional points, they may choose to take a more general approach (small but measurable improvements at the building scale) or a more focused approach (one metric).
Design Priorities
So where should a project team start if they want to earn these LEED points? In general, it makes sense to minimize building demand when system loads are high, and to consider how to take advantage of high-renewable periods when considering load-shifting measures like thermal or battery energy storage.
A few high-level grid contexts and design priorities are discussed below. More specific design guidance will be published by NBI through the GridOptimal Buildings Initiative in the coming months.
- Some regions, such as California, have (or will have in the future, which is more important for the GridOptimal Buildings ACP*) relatively high solar penetrations: they are solar-heavy. Solar PV systems produce more energy during summer and (obviously) during the middle of the day.
- Much of the U.S.—especially the Midwest and Texas—are wind-heavy. Onshore wind in these locations is often stronger at night.
- The Pacific Northwest is hydro-heavy, with high hydro generation during the spring and early summer months as snow melts and rivers run high.
- Many regions are fossil fuel-heavy and are anticipated to remain dominated by large fossil fuel-burning thermal generation for years to come. Emissions are typically highest during grid system peak demand hours but are often also high during off-peak hours.
Demand flexibility is increasingly important in every grid context. To enhance demand flexibility outcomes, designers can include systems that have the capability to shed load (reduce demand) during peak-demand hours. This may require controls at the building level that can communicate with the grid operator or a third party. OpenADR is one example of a communication standard often used by utility programs. Even if the utility is not yet running a demand response or similar program, having the capability to receive and act on that signal helps with a building’s Dispatchable Demand Flexibility score.
The local climate also plays a big role in shaping grid-scale load and GHG emissions patterns.
- Peak system load occurs in summer afternoons in hot places like Florida. However, nearly all regions have a significant summer peak. Strategies that focus on cooling system performance, thermal envelope upgrades, afternoon shading, internal load reductions, and precooling are valuable for grid optimization.
- Some areas experience a winter peak during morning, mid-day, or evening hours. Strategies to reduce energy usage in winter, whether through heating system performance, thermal envelope upgrades, or preheating strategies, are valuable for grid optimization.
- Some locations are dual-peaking, meaning they have both a summer peak and a winter peak. In addition, some regions are summer-peaking today but may become dual-peaking or even winter-peaking as the electrification of building heating systems accelerates.

A New Era for Buildings and The Energy System
Buildings have the power to either enable or hinder the transition to a decarbonized electricity system. Buildings that have been designed utilizing GridOptimal metrics will be better positioned in the future: they will have the power to minimize operating costs, reduce GHG emissions, and benefit from utility incentive programs representing changes in the energy market. And now, building designers can achieve LEED points while doing so.
Resources
For more detailed documentation about the GridOptimal Buildings ACP and to access the GridOptimal calculator used to calculate GridOptimal metrics: http://www.usgbc.org/credits/gridoptimal-152-v4.1
For more about the GridOptimal Buildings Initiative: https://newbuildings.org/resource/gridoptimal/
For more on the new metrics at the core of the GridOptimal Buildings ACP, see this blog or this peer-reviewed conference paper.
If you would like more information about the GridOptimal Buildings ACP, email Alexi Miller at [email protected].
*The GridOptimal ACP uses NREL’s Standard Scenarios forecasts to compare building load shapes to forecasted (2040) grid carbon and system load information at the state level. This information can be viewed and downloaded using the Cambium data viewer.
By Alexi Miller, Associate Technical Director

Bio
