Have you ever visited a zoo or aquarium? How about an art museum, a botanical garden or arboretum, or a historic site? With over 33,000 cultural institutions in the U.S. (UNESCO reports), my guess is that you have been to at least one. While you were there, were you thinking about their energy use, or how much of their (usually limited) annual budget they spend literally keeping the lights on?
Cultural institutions (museums, in short) are critical community resources that serve as a trusted source of documentation and education on important societal issues. According to 2019 data, they support over 726,000 jobs in the U.S. These institutions are not exempt from the impacts of climate change, yet few have the ability or resources to monitor and assess their energy use. This is important because the Environmental Protection Agency (EPA) has found that the simple act of tracking energy use can reduce annual energy consumption by an average of 2.4%—saving money and reducing carbon emissions.
To help fill this gap in operations, New Buildings Institute (NBI), Environment and Culture Partners (ECP), and New England Museum Association were funded by the Institute of Museum and Library Services (IMLS) to conduct the sector’s first in-depth review of the energy use patterns of cultural institutions and develop a roadmap for energy reduction at individual institutions and the sector as a whole. This research project – Culture Over Carbon – worked with a panel of expert advisors to conduct outreach across the U.S. cultural sector, recruiting 133 organizations that provided monthly energy data for their buildings.

Culture Over Carbon: how cultural institutions are using energy today
Using an in-house, simplified building energy modeling tool called FirstView, NBI analyzed monthly energy data from the 133 participating organizations representing over 200 buildings. Each participant received customized reports detailing the energy consumption of their building(s) and how they compare to their peers. To create a more apples-to-apples comparison between buildings, we used energy use intensity (EUI) as our comparison metric. EUI takes the total energy consumption (in the units of kBtu) and divides it by the total square footage of the building. Otherwise, we would be comparing the total energy use of the largest participating building (2 million+ square feet) to the smallest building (950 square feet) and that wouldn’t be a fair comparison.
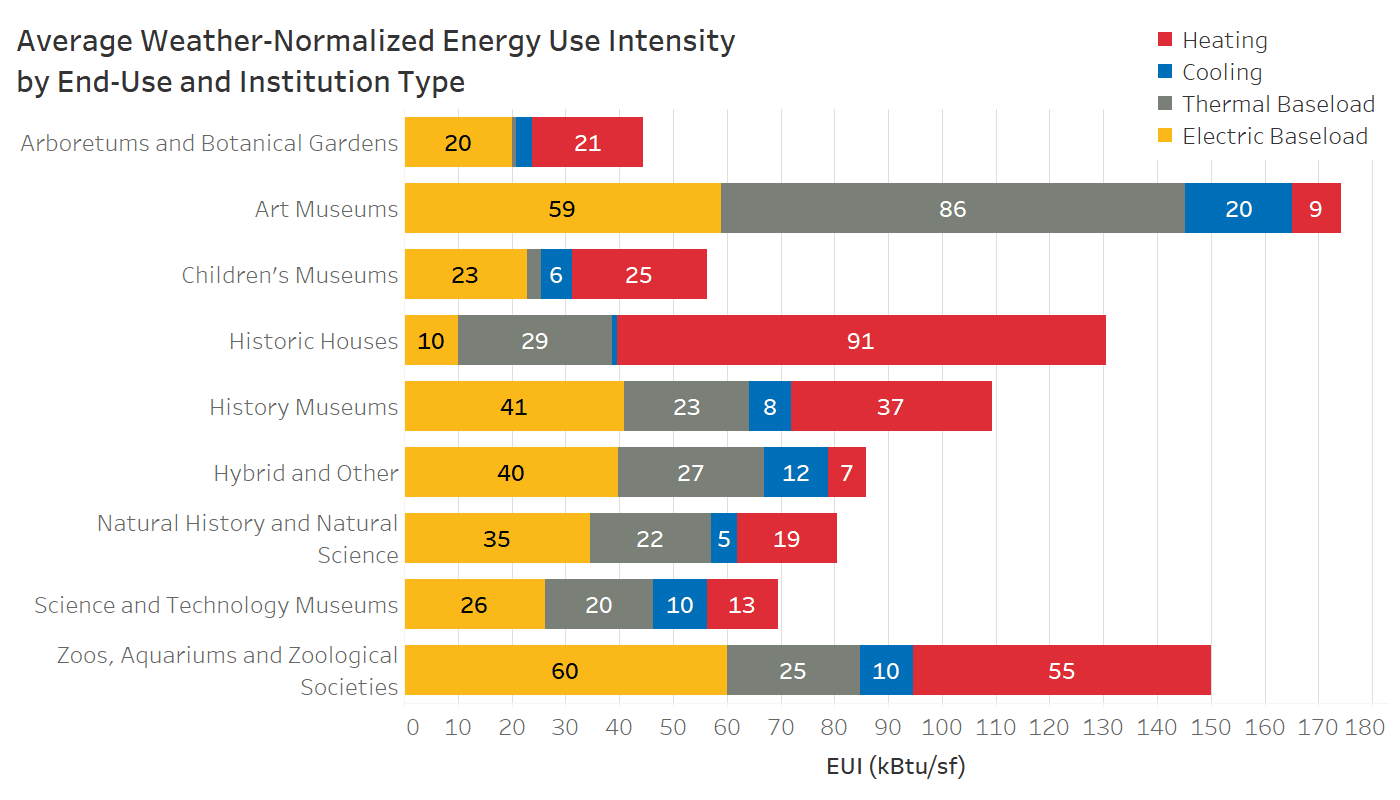
As shown in the figure above, art museums, historic houses, and zoos and aquariums had the highest average EUI, but for different reasons. Art museums had a high thermal baseload due to strict temperature and humidity requirements, while historic houses had a high space heating load. Historic homes’ energy consumption is most likely due to a combination of leaky windows and envelopes, little-to-no insulation, and/or inefficient heating systems – issues that may be difficult to resolve while maintaining historic building status. Zoos and aquariums had high electric baseload, likely related to pumps and other equipment necessary to maintain animal support systems for health and wellbeing (e.g., habitats).
Carbon Inventory Project: Cultivating the U.S. Cultural Sector’s Commitment to Understanding and Reducing Energy-Use Carbon Emissions
Through the Culture Over Carbon project, NBI and ECP gathered information about cultural institution building systems and operations. We heard from participants that the biggest barrier they consistently face when considering and attempting to implement energy efficiency and decarbonization measures was lack of funding. Energy data and mechanical system assessments provide insights that can help institutions visualize and share the need and prioritize them for funding, which can come in the form of grants, incentives, and other cost-share opportunities.

Recognizing that there is a great need for sustainability in the cultural sector but that resources to support this work are limited, NBI and ECP created the Culture Over Carbon Messaging Platform. The resources there help explain…
- why buildings and facilities (especially cultural institutions) provide critical solutions to address climate change
- how cultural institutions can reap the benefits of energy efficiency and decarbonization
- how facility managers can make the case for engaging in sustainability projects
This will become even more important as jurisdictions enact building performance codes and policies that affect cultural institutions. More information about these considerations can be found in the Culture Over Carbon Codes & Policy Factsheet.
In addition to these resources, NBI and ECP created the Carbon Inventory Project (CIP) as a follow-on to Culture Over Carbon. CIP helped staff at cultural institutions build the capacity to monitor and report their own energy use and familiarized them with the free energy management tool ENERGY STAR® PortfolioManager™, with the goal of developing a preliminary sample of aggregated sector data on the impacts of energy-use carbon emissions. We can use that knowledge to raise awareness about the U.S. cultural sector’s impact on climate and take stronger action. Learn more in the Carbon Inventory Project Factsheet.
These efforts will culminate in the first annual “Carbon Day” on June 16, in conjunction with Net Zero Buildings Week. When we will report the results from leaders in the sector that committed to being a part of this groundbreaking effort.
Moving forward: track results, stay in touch, and keep cultural institutions in mind
In addition to the Carbon Day reporting on June 16, we will publish our final report and a quick guide to energy efficiency and decarbonization recommendations this summer. Please help by spreading the word about this work.
Cultural institutions can help their communities understand the challenges of climate change and model solutions that provide global impacts at scale. We know it can be a challenge – institutions of all sizes and budget amounts can struggle with energy tracking, efficiency upgrades, and reducing carbon emissions. But everyone must start somewhere, and it’s okay if it isn’t perfect right away. If you work for a cultural institution, connect with us. If you work with cultural institutions staff, encourage them to plug in to our ongoing efforts to make an impact in the sector. If you visit a cultural institution, tell them about our work and how they can move into the decarbonized future of buildings.
Learn about Carbon Day results and keep up with our ongoing work for cultural institutions bysigning up for ECP’s newsletter here. You can also receive updates from NBI on LinkedIn, Twitter, and our newsletter.
Top photo: Oregon Museum of Science and Industry (OMSI), Portland, OR
Author
by Mischa Egolf, Technical Associate
Bio
Did you enjoy this content? Consider supporting NBI’s work with a donation today.