Getting to Zero Buildings Lists
Document / September 24, 2020 / Getting to Zero
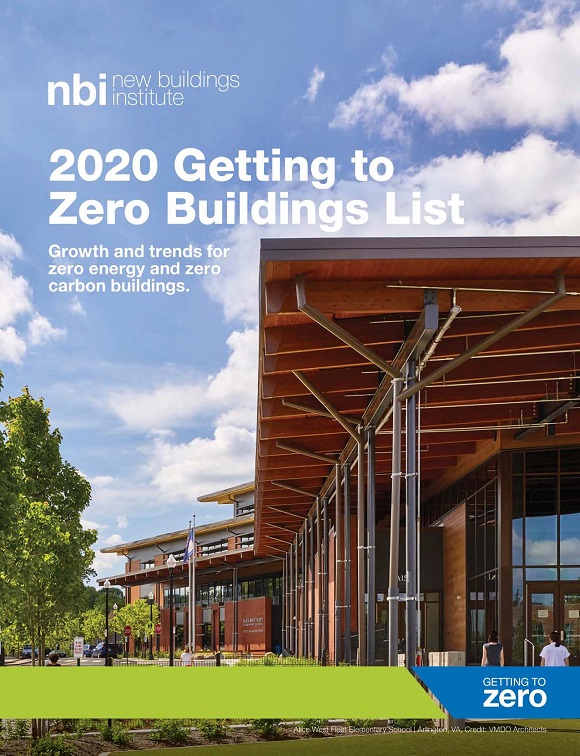
NBI's 2020 list of pioneering zero energy (ZE) projects represents the latest growth in a rapidly expanding market. For this list, ZE buildings are extremely energy efficient, with a median site EUI of only 23 kBtu/sf/yr*, and consume only as much energy as is produced onsite with clean, renewable energy resources such as solar. As policies and programs advance, designers and building owners continue to seek ever-higher levels of performance and environmental stewardship. In this list you will find ZE projects with ZE performance that has been certified by a third-party or verified by NBI. These trailblazing buildings, portfolios, districts, and campuses have demonstrated that getting to zero energy design and operation is feasible in every climate, market sector, size, and building type across the U.S. and Canada.
2020 Getting to Zero Building List
Webinar
Watch an on demand webinar sharing The Getting to Zero Market Landscape and 2020 Zero Energy Buildings List.
Searchable Database
You might also be interested in NBI’s Getting to Zero Buildings Database, an online tool with an interactive map and list of emerging and searchable verified building projects.
2020 Getting to Zero Project List Graphs
The eight charts and graphs below have been developed to summarize and highlight key information. If this is not rendering well on your phone or tablet, try turning to make it horizontal. Click on the “figure” links to view and save. Please cite New Buildings Institute in all uses.
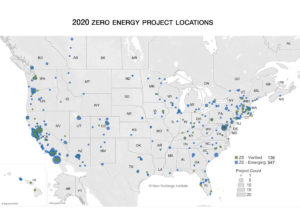
| Figure 1
Project Locations: Across the United States and Canada, ZE projects span all climate zones and nearly every state and province. |
 |
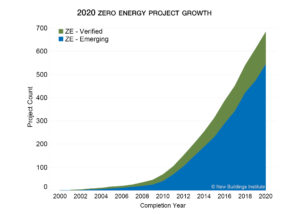
| Figure 2
Project Growth: The project list includes nearly 700 projects and is on a steep curve upward, having more than doubled in size since 2015. |
 |
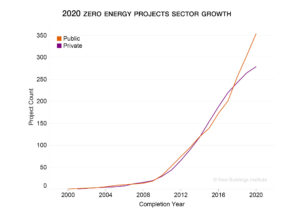
| Figure 3
Project Growth by Sector: The growth of public and private zero energy projects is closely aligned. |
 |
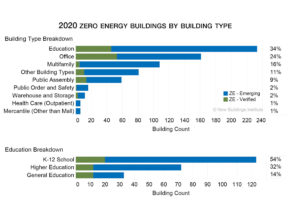
| Figure 4
Building Types: Zero energy projects span over 100 distinct building types, with over half falling in the education and office sectors. |
 |
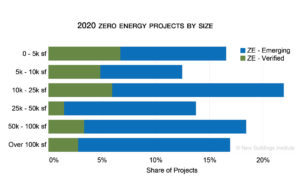
| Figure 5
Size Distribution of Projects: Zero energy projects are found in all sizes, including entire campuses and portfolios. |
 |
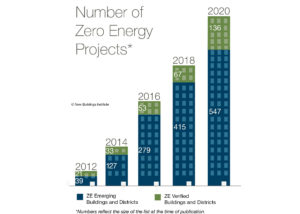
| Figure 6
Number of Zero Energy Projects: The number of verified zero energy buildings in the U.S. and Canada increased between 2012 – 2020, between 2018 and 2020 they more than doubled. |
 |
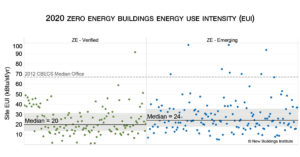
| Figure 7
Energy Performance Data: Zero energy buildings use roughly half the energy of conventional buildings. The median Energy Use Intensity (EUI) of verified building is 20 kBtus/sf/year. |
 |
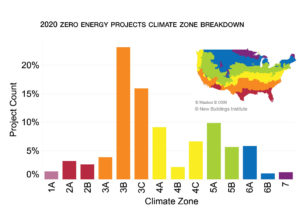
| Figure 8
Buildings by Climate Zone Breakdown: In some climates, ZE is more prevelant. This chart shows the count of buildings by climate zone. |
 |
Past Editions
2019 Getting to Zero Building List 2018 Getting to Zero Building List 2016 Getting to Zero Building List 2015 Getting to Zero Building List 2014 Getting to Zero Building ListMore background
Resources for the press are available on the Getting to Zero website.
