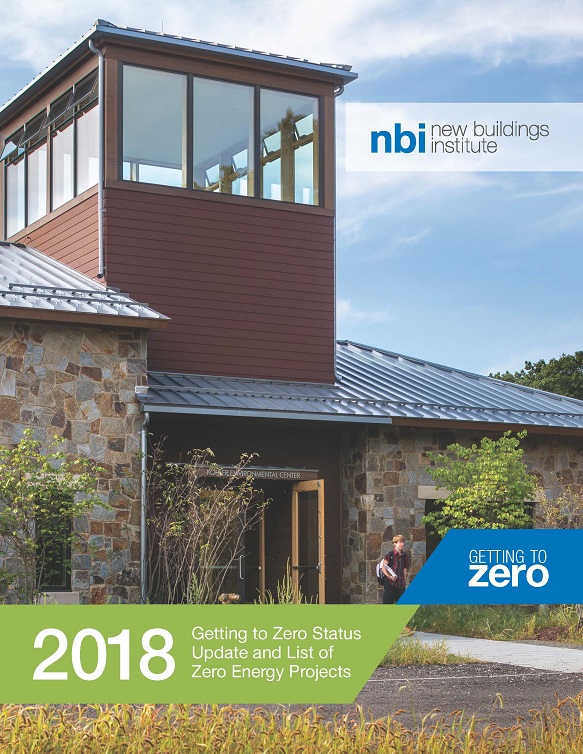
2018 Getting to Zero Status Update
Report / January 23, 2018 / Getting to Zero

We are pleased to share the 2018 Getting to Zero Status Update and Zero Energy Buildings List, which summarizes the growth and trends from nearly 500 certified, verified and emerging zero energy projects across the United States and Canada. In the first Getting to Zero Status Update, published in 2012, we reported on 60 commercial and multifamily buildings or projects. The 2018 list reflects a steep curve upward with our count increasing over 700% in six years.
Webinar
Learn more from the 2018 Getting to Zero Status Update and Zero Energy Buildings List. Watch the webinar
Graphs
Here we also provide graphs from the report that highlight key information.
Figure 1. Zero Energy Building Growth: The Buildings List includes nearly 500 projects and is on a steep curve upward, having increased over 700% since 2012.
Figure 2. Number of Zero Energy Buildings: There are now 67 ZE Verified and 415 ZE Emerging projects documented by NBI.
Figure 3. 2018 Buildings List Project Locations: ZE Projects by region and state/province. The legend shows regional growth trends in projects since our 2014 List.
Figure 4. Climate Zone Distribution of Zero Energy Projects: Zero Energy buildings are in every climate zone across the U.S.
Figure 5. Gross EUI Distribution of ZE Projects: This chart shows the range of energy usage (gross site EUI, not including renewables) for the zero energy projects in this List. The grey band covers the 20th to the 80th percentile in each group.
Figure 6. Size Distribution by ZE Category: Nearly 30% of all buildings and 88% of the total floor space of ZE Emerging buildings are 50,000 sf or larger.
Figure 7. Building Type Breakdown: Zero energy buildings can be found across many different building types.
Figure 8. Building Ownership Type Distribution: Buildings owned by for-profit companies now making up 26% of the List.
Figure 9. ZE Growth by Building Sector: ZE Verified and ZE Emerging projects by ownership. Projects with missing ownership data are excluded.
Figure 10. Growth by Building Ownership: ZE Verified and ZE Emerging projects by ownership. Projects with missing ownership data are excluded.
Figure 11. 2017 zEPI Jurisdictional Scores: NBI has developed zEPI Jurisdictional Scores, which rank states based on their adopted energy policy.
Figure 12. Energy Performance of Radiant-Conditioned Buildings: This boxplot compares the interquartile energy performance of the research set alongside a comparable subset of buildings from CBECS, the building performance database (BPD), and NBI’s ZE Verified Buildings List. The radiant buildings included in the study used approximately 30% less energy than national benchmark values.
Figure 13. Energy Performance of ODOT Building vs. Benchmarks: The ODOT building outperforms various national and state-level benchmarks. The building uses slightly more than half the energy of its code baseline.
