ACEEE’s 2017 State Energy Efficiency Scorecard was released in late September with Massachusetts leading based on six categories including utility programs, transportation, building energy codes, combined heat and power, state initiative and appliance standards, according to ACEEE. Looking ahead, there are changes afoot for the 2018 Scorecard ranking methodology that will incorporate a new metric: the zEPI Jurisdictional Scores.
The new scoring approach was developed by New Buildings Institute (NBI) staff—Codes and Policy Director Jim Edelson and myself (Kevin Carbonnier, Project Manager)—to address the growing number of states looking to drive local building stock toward zero energy (ZE) performance. That is, homes and commercial buildings that produce as much energy as they use over the course of a year, with performance achieved through energy efficiency and renewable technologies. California’s zero net energy goals for residential and commercial new construction, the District of Columbia’s proposed net-zero energy code path, and city- and county-led efforts in Idaho and Colorado are a few examples of locales amending building energy codes to deepen savings and move states closer to ZE goals.
To develop a common baseline against which the energy performance of code-compliant buildings can be compared across states, NBI has applied the Zero Energy Performance Index (zEPI) scale to create the zEPI Jurisdictional Score. This new method uses a framework for calculating scores for entire states based on their adopted energy policy, and taking into account statewide energy codes and local stretch codes. By leveraging new code analysis published by Pacific Northwest National Labs and combining it with NBI’s in-house policy tracking work, we were able to calculate zEPI Jurisdictional Scores for every state with adopted energy codes, and for others without a statewide code which have sufficient data available on local adoptions.
zEPI scale offers a measure for progress and comparison
So why zEPI? NBI has long been a proponent of zEPI, created by Charles Eley and further developed by Eley, NBI and others. What zEPI offers is a steady, linear metric focused on zero energy which does away with the ambiguous “percent better than code” issue. Comparing buildings, code, jurisdictions or any scale of energy impact is challenging with the commonly reported percent better than code figures. Another question that comes to mind is, which code? There are over a dozen to choose from. Few of us are familiar with how the expected performance between codes compare. Would you be able to say whether an office in Portland that is 20% better than the 2015 IECC (International Energy Conservation Code) uses less energy than one that is 25% better than ASHRAE 90.1-2013?
energy performance on the path to zero
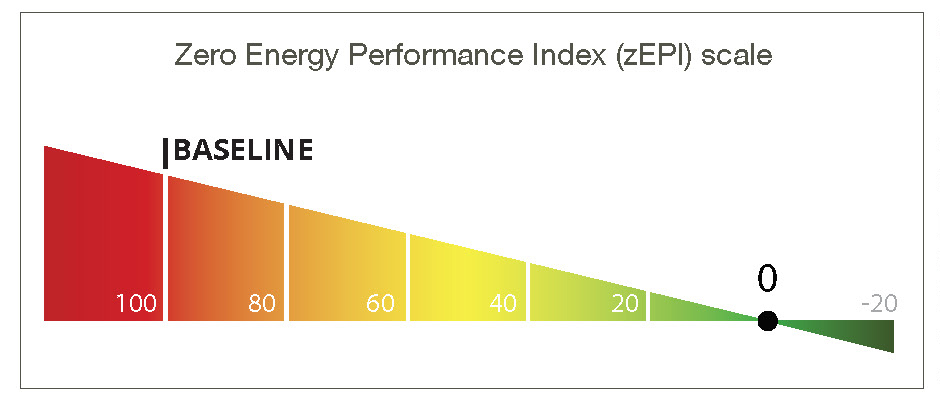
With the zEPI scale, we can easily compare between different code levels, climate zones, and building types. By fixing the baseline to CBECS 2003 performance levels (zEPI 100) and the goal to net zero (zEPI 0), we create a linear scale which can be used to track progress towards zero.
The new metric for scoring state progress

Beginning next year, ACEEE plans to transition to the zEPI Jurisdictional Score as the new basis for ranking state building energy performance in an effort to more accurately assess the levels of savings achieved by each state’s adopted building energy codes. With their absolute baseline and common zero value, the zEPI rankings for jurisdictions will allow the ACEEE Scorecard to look beyond simple code status and actually monitor how states are improving the performance of their codes. See the chart for how the top 10 state residential and commercial codes currently rank on the zEPI scale, based on adopted codes effective as of January 2017. While Massachusetts ranked first in the current Scorecard, it drops slightly to second behind Hawaii in the new rankings with California ranking third.
To see the full preliminary results of the new zEPI Jurisdictional Scores, visit page 86 in the 2017 list (http://aceee.org/research-report/u1710). For details on methodology, see our factsheet.
With a metric that gives a clear vision to zero energy, tracking the zEPI rankings of energy code models and jurisdictional adoption will provide straightforward feedback to policymakers and a variety of stakeholders on how they are progressing toward a low-carbon future. As is the case with the annual Scorecard, the new zEPI Jurisdictional Scores are expected to promote a little competition between states, to boot!
by Kevin Carbonnier, Project Analyst